The GCD software produces a rich set of results with each change detection analysis. This section describes both the user interface for exploring results within the software as well as the files that are saved to the project folder structure as part of the analysis.
User Interface
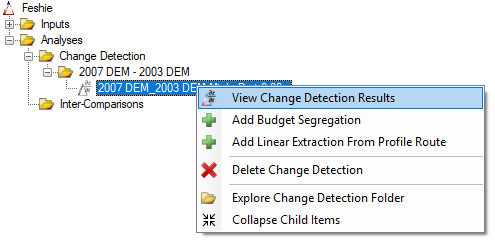
The change detection results user interface is displayed once the analysis has completed. They are also accessible by right clicking on an individual change detection in the project explorer:
Tabular Results
The initial view of the change detection results is a summary of the raw and thresholded surface raising and lowering. The best way to understand the contents of this table is to hover over each cell in the left most column to display the tool tips describing the values.
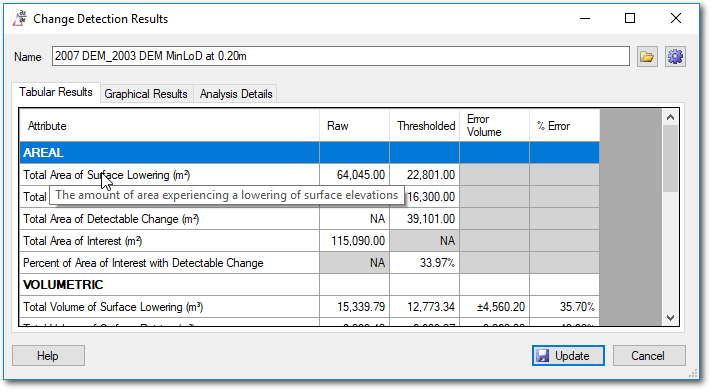
This table is also saved as an Excel Spreadsheet in the Summary.xml file.
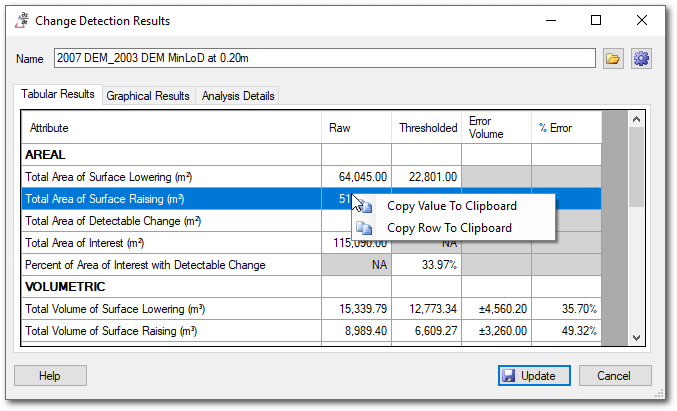
Also, the value of each cell, or an entire row, in the table can be copied to the clipboard using a right click:
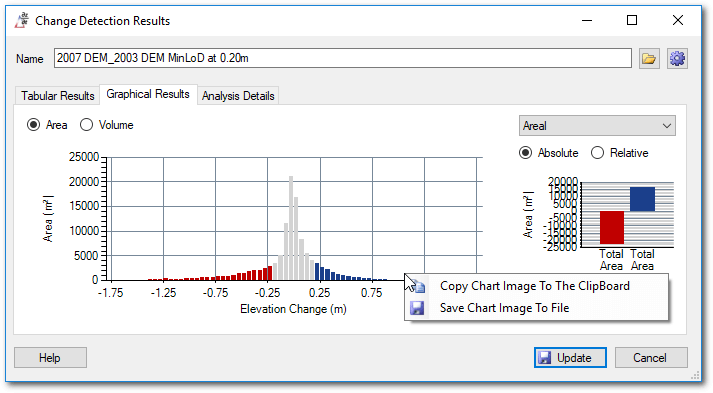
Graphical Results
The graphical results tab displays areal and volumetric histograms summarizing the raw and thresholded changes.
Right clicking on the charts lets you copy the chart in question to the clipboard or save the image to file. This is useful if you have customized the chart using the settings button on the top right.
Analysis Name Editing
The name of the analysis can be edited while viewing the change detection results. Be sure to click the ![]() Update button to save this change to the GCD project.
Update button to save this change to the GCD project.
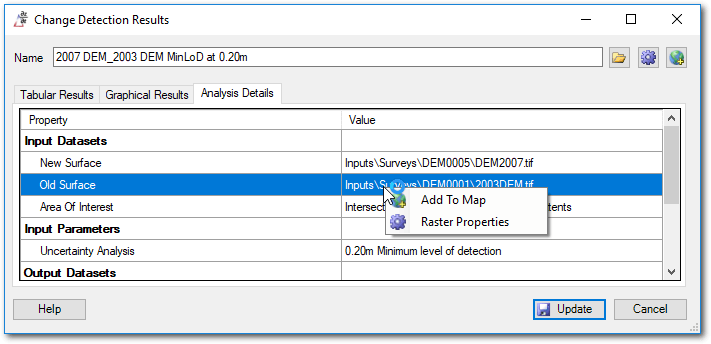
Analysis Details
A summary of the inputs and parameters for the change detection is displayed on the analysis details tab. Cells that represent the path to a raster file can be right clicked to display the raster properties and also add the raster in question to the current ArcMap document (GCD AddIn only).
Customize Display Settings
The settings button ![]() at the top of the right of the results form opens the settings for the results display for customizing how the results are displayed. Note that these settings don’t affect the files that have already been generated, but merely the current display.
at the top of the right of the results form opens the settings for the results display for customizing how the results are displayed. Note that these settings don’t affect the files that have already been generated, but merely the current display.
Units Settings
The linear, areal and volumetric units used on both the tabular and graphical results can be customized. The precision value controls how many decimal places are displayed. Clicking the reset ![]() button reverts the values back to those specified of the GCD project.
button reverts the values back to those specified of the GCD project.
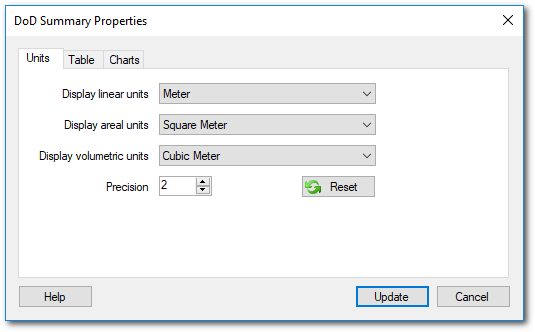
Table Settings
You can control which rows and columns are visible on the tabular results tab.
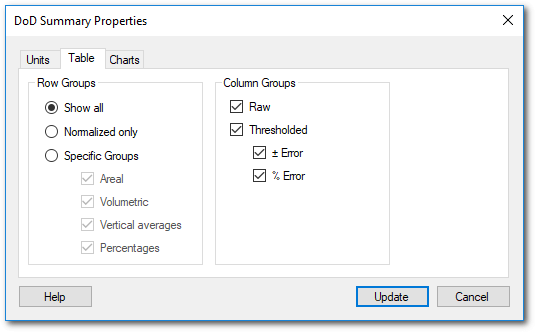
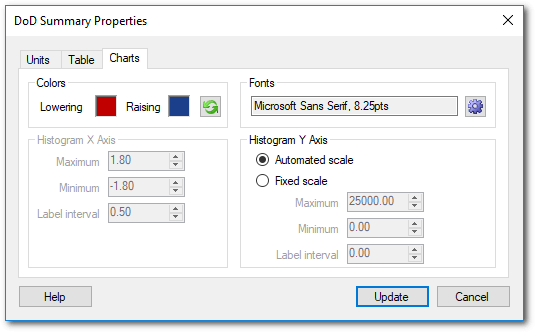
Chart Settings
The chart settings tab controls several aspects of the change detection histograms and bar charts.
- Both the lowering and raising colors and also the fonts affects the current GCD session only. If you close GCD and reopen it, the colours will revert to those specified on the GCD settings. Clicking reset will also revert back to thse same settings.
- The Histogram X Axis settings are currently disabled and under development.
- The Histogram Y Axis allows you to fix the scale of the vertical axis. This can be used to produce graphics files across multiple analyses or projects all with the same fixed scale.
Files and Folders
The results for an individual change detection are placed in a folder under the project called Analyses. Inside that folder is another called CD for “change detection” and then each analysis gets a sequentially numbered folder with the prefix DoD. For example
[ProjectName]\Analyses\CD\DoD0001
Within this folder are the following files and folders that contain the results of the GCD:
| Path | Description |
|---|---|
raw.tif |
The spatial results of the change detection in raster format without applying any thresholding techniques. Simply DEMnew - DEMold. |
thresh.tif |
The spatial results of the change detection in raster format with the error with the thresholding techniques applied. |
raw.csv |
Numerical results of the change detection in comma separated values format without applying any thresholding techniques. It contains the following fields Lower Elevation Range, Upper Elevation Range, Total Area, Total Volume, Number of Cells. This is the areal and volumetric changes placed into preset bins. |
Summary.xml |
Summary of numerical results of the change detection in Microsoft Excel format. It contains results both with and without applying thresholding. This the same table that is presented within the GCD software by right clicking on a change detection and choosing view change detection results. |
thresholded.csv |
Numerical results of the change detection in comma separated values format with the thresholding techniques applied. Simply DEMnew - DEMold. It contains the following fields Lower Elevation Range, Upper Elevation Range, Total Area, Total Volume, Number of Cells. This is the areal and volumetric changes placed into preset bins. |
Figs |
Folder of pre-generated figure graphics. |
Figs\ChangeBars_AreaAbsolute.png |
Bar chart of the actual area of change for erosion and deposition. Red is surface lowering and is represented by negative values. Blue is surface raising and is represented by positive values. |
Figs\ChangeBars_AreaRelative.png |
Bar chart of the relative area of change for surface lowering and raising, absolute values are used to allow for easier comparisons. Both raising and lowering are represented by positive values. |
Figs\ChangeBars_DepthAbsolute.png |
Bar chart of the actual average depth of change for erosion and deposition. Red is lowering and is represented by negative values. Blue is raising and is represented by positive values. |
Figs\ChangeBars_DepthRelative.png |
Bar chart of the absolute average depth of change for surface raising and lowering, absolute values are used to allow for easier comparisons. Both raising and lowering are represented by positive values. |
Figs\ChangeBars_VolumeAbsolute.png |
Bar chart of the actual volume of change for erosion and deposition. Red is surface lowering and is represented by negative values. Blue is surface raising and is represented by positive values. |
Figs\ChangeBars_VolumeRelative.png |
Bar chart of the relative volume of change for erosion and deposition, absolute values are used to allow for easier comparisons. Both surface raising and lowering are represented by positive values. |
Figs\Histogram_Area.png |
Histogram of the area of change. Red is surface lowering. Blue is surface raising. |
Figs\Histogram_Volume.png |
Histogram of the volume of change. Red is surface lowering and bluw is surface raising. |